What is a sprint burndown chart?

The world of Agile methodology is a confusing one. There are so many “cool” names for things, jargon and buzzwords to get your head around that it can seem a little overwhelming when making the transition.
Luckily for you, you’re in the right place to learn everything there is to know about Scrum and Agile. The EasyRetro blog has a wealth of knowledge to help you get ahead, including what a burndown chart is and how to use one.
Sprint burndown chart: a definition
Simply put, a burndown chart shows how much work has been completed during the sprint and how much is left to do.
It can also be a handy tool to help identify any “scope creep”, but we’ll come back to that later.

Sprint burndown chart: the benefits
Burndown charts allow your team to easily visualize the likelihood of completing the allotted work, within the time, allocated to that sprint. It clearly reflects the team’s progress, shows them which tasks are left to do, and how long there is left to do them.
Because the burndown chart is simple to understand, your team will be able to spot potential bottlenecks and tackle them before they become an issue.
If a team is consistently missing deadlines — or even finishing up earlier than expected — a burndown chart can help visualize workflow so the team can adjust accordingly. This helps teams make the most of the time they have available in every sprint.
Identifying “scope creep” is another benefit of burndown charts, as we mentioned before. It’s a situation we’ve all experienced before: when the pre-defined features, scope, and deliverables of a project have grown from their initial specifications — without the budget or timeframe being adjusted as well.
Scope creep is a very real threat that can affect any fixed-scope project, but if you’re truly working with the Agile methodology, you should always be adapting to the changes as they happen. That’s where the burndown chart comes into play.
The burndown chart will clearly illustrate that minimal progress is being made, even if the team is working hard to keep up with the changes.

Getting started with burndown charts
A burndown chart doesn’t need to be fancy or complicated — the entire point is to give your team an accurate representation of where they are in the project at a glance. That being said, working out your burndown chart is a process you need to get right, or you risk running into trouble down the line.
Here’s a step-by-step guide to creating a burndown chart, based on a 5-day sprint with 8 tasks in the backlog. Let’s also assume that sprint velocity has already been calculated with a result of 80 available hours.
Step 1: Estimate effort
This is where your team looks at the number of available hours and days to form a baseline of how many hours should be used per day to stay on track. Put simply, we’re going to divide the available hours by how many days the sprint is due to last.
So, based on the values we’re working with in this example, it would be 80 hours over 5 days, which leaves us with 16 hours per day.
In order to create the burndown chart for this sprint, the data needs to be captured as a daily running total starting with 80 hours and subtracting 16 hours per day. So it would leave 64 hours at the end of the first day, 48 hours at the end of the second day, and so on.
Step 2: Estimate daily progress
You need to provide a baseline estimate for how much effort will be put into each task. The available hours will be divided by the number of tasks that need to be completed during the sprint.
In our example scenario, this would be 80 hours divided by 8 tasks, leaving 10 hours per task.
These first two steps provide the metrics you will be using to compare with the rate of actual work being done.
Step 3: Calculate actual effort
At the end of each day, an actual effort figure should be recorded to represent the remaining available hours. This is the metric that will be used to compare against your estimate to ensure that the sprint is running on schedule, or if tweaks need to be made.
Step 4: Create your burndown chart using the fresh dataset
As the data comes in, you can start using the dataset to build your burndown chart. Good spreadsheet software will help you create the chart with the data you’ve inputted.
But for an even quicker, easier way of building a burndown chart, check out our free burndown chart generator here!
How to read your sprint burndown chart
Alright, now you have a great-looking burndown chart, but do you really understand what it is telling you? Sure, a simple 2-line chart may seem self-explanatory, but some of a burndown chart’s vital insights are easily missed.
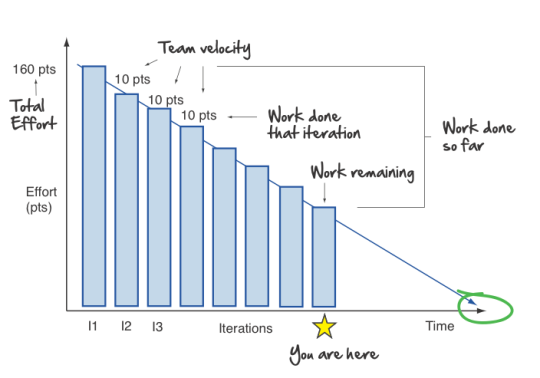
Take this example from AgileNutshell.com. Within this burndown chart, you are able to see the team’s velocity and total effort (this chart shows “points” rather than hours, but they are two names for the same quantifier). Yet there is much more information on display here, including:
- Work done per day (iteration)
- Work remaining
- Total work completed so far
- Estimated completion date
Utilized correctly, a burndown chart can give you accurate and eye-opening insights into your team’s workflow. This can be used to improve workflow, decrease time wastage and save money.
Create burndown charts — and use them in your retrospectives!
Lastly, burndown charts can be great tools to look back on during a retrospective as they help with assessing the following:
- How good is the team with planning?
- How effectively is this team performing against the stories planned in a sprint?
- Is the team self-organized and working in unity?
- What refinements could this team do?
Of course, this isn’t the only tip we have to improve your end-of-sprint retrospectives. The EasyRetro blog is packed full of amazing tricks, tips, and insights. Used alongside our great range of tools, EasyRetro can push your team to the next level and help you truly embrace the scrum methodology!
Improve your team with fun sprint retrospectives
Create unlimited boards for free and make retrospectives fun again